Showing posts with label notes. Show all posts
Showing posts with label notes. Show all posts
02 July 2010
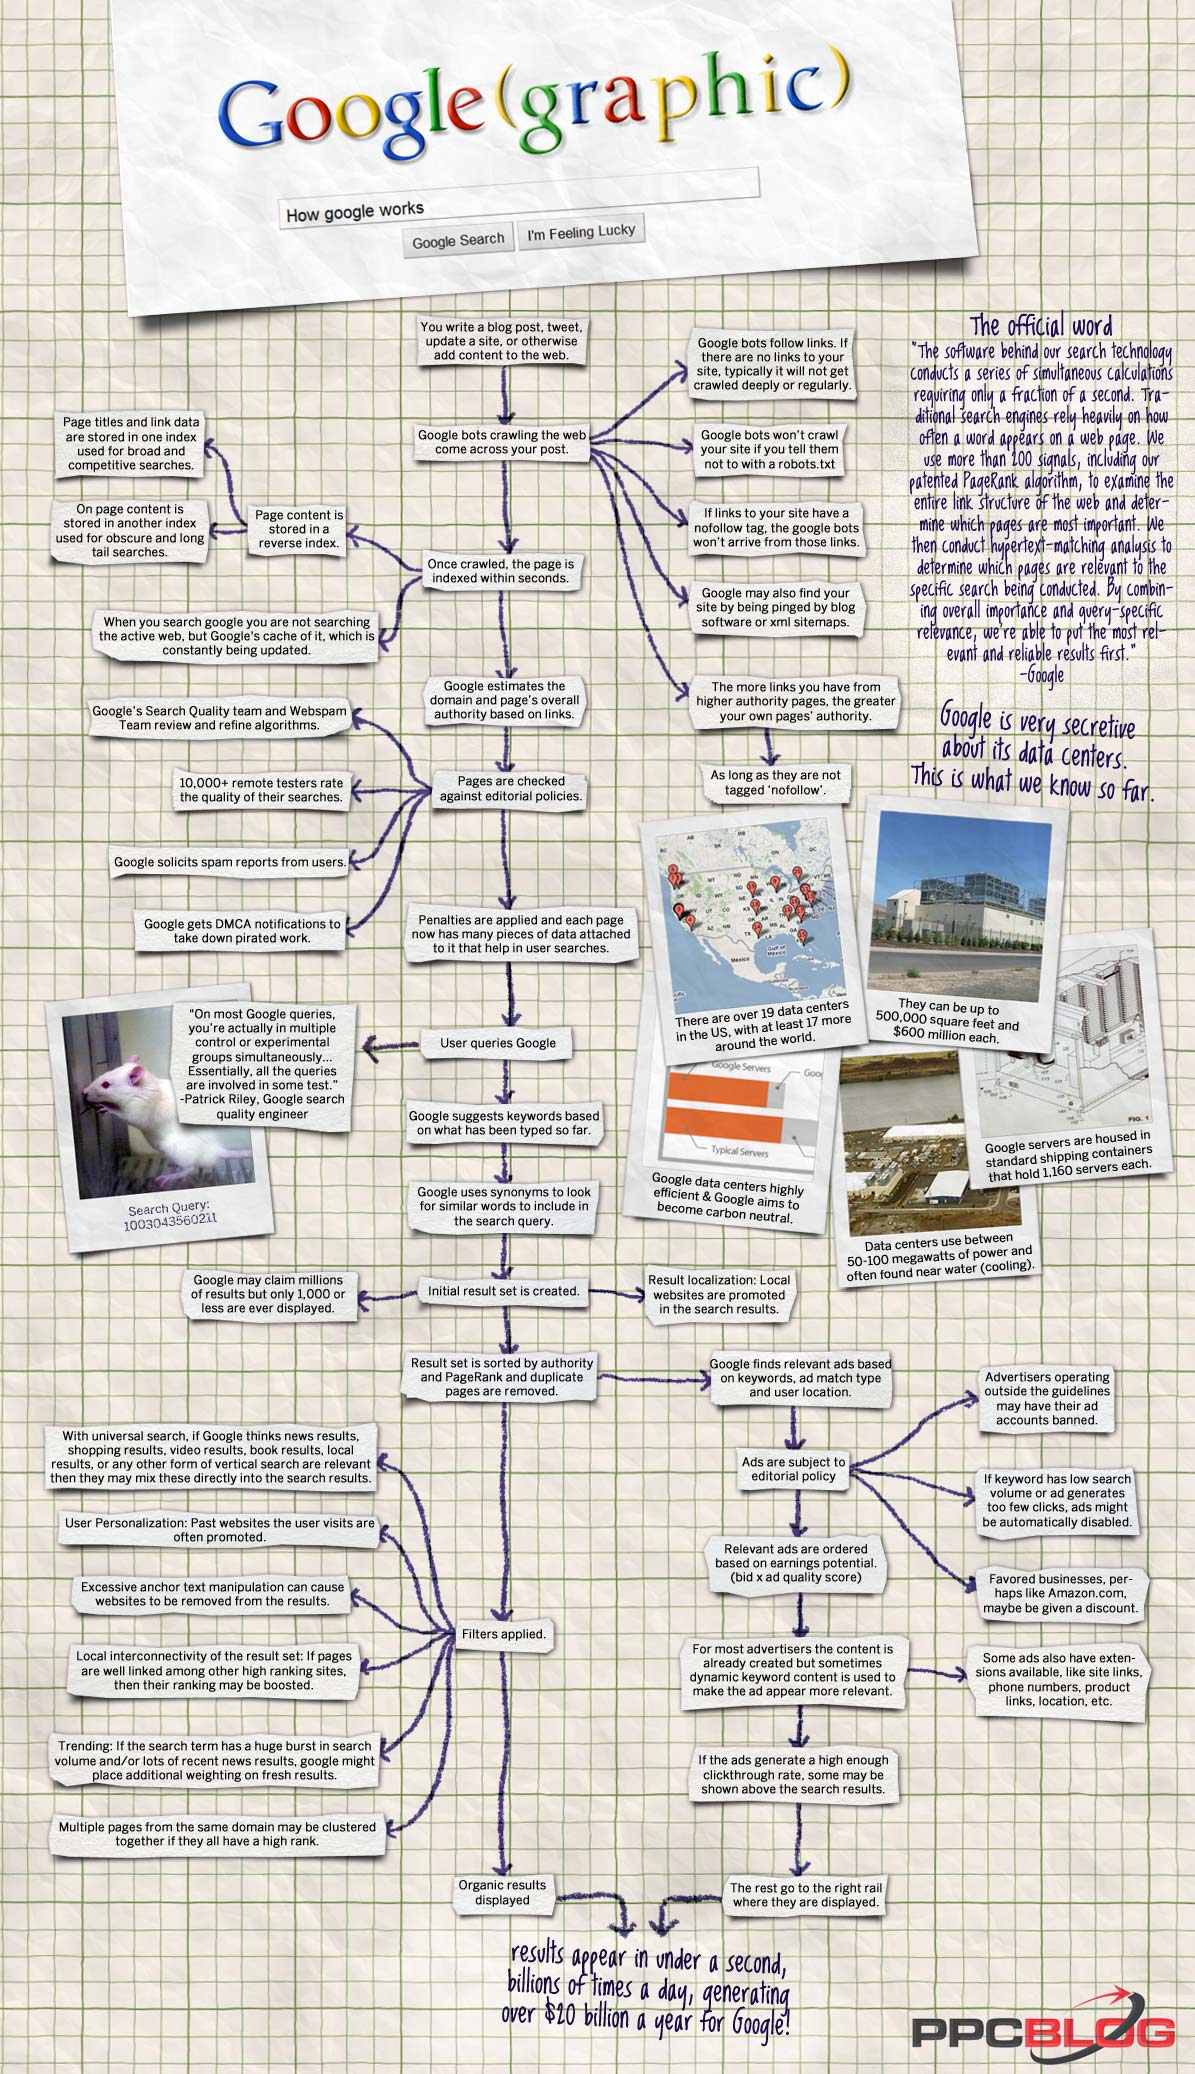
How does Google work?
I suppose this is the second most frequently asked question and I'm delighted to be able to link to the remarkable graphic produced by PPCblog. I have no idea who they are or what PPC stands for. Readers who know me well may think it's something to do with the Paddock Party Committee whose Minutes are amusingly published on another of my blogs. It isn't. But well done to the other PPC, whoever they may be.


08 November 2007
Woo-hooo, I can do forms!
There are probably a hundred other things I should be doing this evening but I am so pleased about what I can do with Zoho Creator that I just have to tell someone.
Forms on the web. Things that collect information. Things that people can type into on a web page and hit a button and you get the data a few seconds later. Now all you PHP geeks can stop reading but those of you who, like me, have no clue about PHP, don't have MySQL or other strange sets of initials on their web server and especially those who haven't the foggiest whether they do, but can copy and paste some html code into a web page or a web log should read on . . .
I have used CoffeeCup's Form Builder to create some data gathering forms on some sites but two things almost brought me to my knees. The first was that many clients don't have hosting for their web sites that has all the extra bits that can handle forms (and didn't want to pay the not inconsiderable sums demanded to get it). The second was that for those who had (or did) the flaming thing didn't work. Eventually I discovered that an extra line of PHP code was needed to make it work on at least one well-known host. It wasn't the sort of code that comes naturally, with odd expressions, essential spaces and e-mail references that were enough to confuse a giraffe in a forest. Still more communication proved necessary to persuade the host to make the mail address work too. However, at the time, it was the best I could do and it worked. I just dreaded the client asking me to change it one day!
Now I've discovered what Zoho Creator can do. It is amazingly simple. There are ready-made examples available. You edit one, get the code and paste it on a suitable page. That's it! Zoho seem to take care of all the 'server side' stuff. What's more, the data can be collected and viewed in a spreadsheet amongst other options and you can provide links for others to see the data on-line. That bit, sharing data on-line, I have referred to before and is excellent. I just hadn't noticed the forms before, despite circulating the video guide in a previous post.
So I shall now be up all night putting samples everywhere and writing to people whom I hadn't been able to help before. All sorts of uses, including getting student feedback and giving visitors a place to comment on the webtools site. That one is my first effort. Took 5 minutes start to finish.
Forms on the web. Things that collect information. Things that people can type into on a web page and hit a button and you get the data a few seconds later. Now all you PHP geeks can stop reading but those of you who, like me, have no clue about PHP, don't have MySQL or other strange sets of initials on their web server and especially those who haven't the foggiest whether they do, but can copy and paste some html code into a web page or a web log should read on . . .
I have used CoffeeCup's Form Builder to create some data gathering forms on some sites but two things almost brought me to my knees. The first was that many clients don't have hosting for their web sites that has all the extra bits that can handle forms (and didn't want to pay the not inconsiderable sums demanded to get it). The second was that for those who had (or did) the flaming thing didn't work. Eventually I discovered that an extra line of PHP code was needed to make it work on at least one well-known host. It wasn't the sort of code that comes naturally, with odd expressions, essential spaces and e-mail references that were enough to confuse a giraffe in a forest. Still more communication proved necessary to persuade the host to make the mail address work too. However, at the time, it was the best I could do and it worked. I just dreaded the client asking me to change it one day!
Now I've discovered what Zoho Creator can do. It is amazingly simple. There are ready-made examples available. You edit one, get the code and paste it on a suitable page. That's it! Zoho seem to take care of all the 'server side' stuff. What's more, the data can be collected and viewed in a spreadsheet amongst other options and you can provide links for others to see the data on-line. That bit, sharing data on-line, I have referred to before and is excellent. I just hadn't noticed the forms before, despite circulating the video guide in a previous post.
So I shall now be up all night putting samples everywhere and writing to people whom I hadn't been able to help before. All sorts of uses, including getting student feedback and giving visitors a place to comment on the webtools site. That one is my first effort. Took 5 minutes start to finish.
23 October 2007
Optimise Firefox for broadband
You will know that I much prefer Mozilla Firefox to Internet Explorer for a bundle of reasons, including basic things like being able to change the way it looks and more nerdy things like the web developer toolbar which is a must for people like me. I also like the way I can have the same bookmarks available from all the computers I use. Regrettably, I can't ditch IE completely as there are several sites like ITV and Facebook with features that just don't work in Firefox but I live in hope. What I hadn't realised was that Firefox comes set up by default to run on dial-up connections and you can get a significantly faster experience by changing some of its deep, registry-type settings.
PC Advisor recently had an excellent article guiding you through the steps and here's the link for those who wish to try. It is not for anyone nervous about fiddling around in what will appear strange areas, though, and even for those who are confident, backing up the preferences javascript file is important, for which details are also provided in the article.
OK, so this may not be my most enthralling post but I think Firefox fans will appreciate the difference the tweaks will make.
PC Advisor recently had an excellent article guiding you through the steps and here's the link for those who wish to try. It is not for anyone nervous about fiddling around in what will appear strange areas, though, and even for those who are confident, backing up the preferences javascript file is important, for which details are also provided in the article.
OK, so this may not be my most enthralling post but I think Firefox fans will appreciate the difference the tweaks will make.
19 October 2007
1+1=3
This is, of course, an extremely old trick in Excel which I use to try and generate some interest in spreadsheets when teaching at the sleepy 3pm slot.
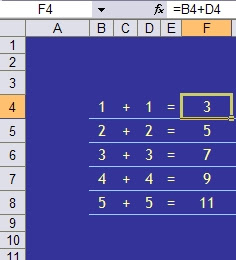
The formula for F4 looks fine, so why on earth does it show the wrong answer?
It's all to do with the difference between what Excel knows and what Excel shows. The figures above have had their decimal display adjusted so the display is rounded to the nearest whole number. In fact the data in B4 and D4 is 1.4 and in F4 Excel calculates 2.8
Whilst this may seem either stupid to do in the first place, obvious or generally something you don't need me to tell you about, problems can arise when, for example, dealing with money. You may well not notice that costs from some other calculations, rounded to the nearer penny, actually add up to a different total than the figure Excel shows as a total. Excel will add the exact figures (calculating up to 15 decimal places) and then round the total to the nearer penny - not necessarily the same thing. In an RSA OCR spreadsheet exam many years ago this occurred and only one out of hundreds of students spotted it and asked me what to do.
If you prefer to have 1 and 1 making 2, and totals of displayed figures adding up to the same figure as you'd get from good old mental arithmetic, counting on fingers or even an old calculator, then you'll need to tell Excel what you want.
There are three useful formulae:
=ROUND() does what Excel does naturally when you change the decimal display, rounding to the nearest number of digits indicated
=INT() may be more useful, displaying just the whole number
=TRUNC() is the best option, restricting the number stored to a chosen number of digits.
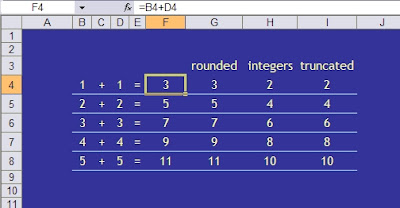
You could now, for example add up column H or I and get 30 using the usual sum formula. It is important to apply the formula at the right stage of a calculation but this might help avoid less obvious but potentially costly or embarrassing errors.

The formula for F4 looks fine, so why on earth does it show the wrong answer?
It's all to do with the difference between what Excel knows and what Excel shows. The figures above have had their decimal display adjusted so the display is rounded to the nearest whole number. In fact the data in B4 and D4 is 1.4 and in F4 Excel calculates 2.8
Whilst this may seem either stupid to do in the first place, obvious or generally something you don't need me to tell you about, problems can arise when, for example, dealing with money. You may well not notice that costs from some other calculations, rounded to the nearer penny, actually add up to a different total than the figure Excel shows as a total. Excel will add the exact figures (calculating up to 15 decimal places) and then round the total to the nearer penny - not necessarily the same thing. In an RSA OCR spreadsheet exam many years ago this occurred and only one out of hundreds of students spotted it and asked me what to do.
If you prefer to have 1 and 1 making 2, and totals of displayed figures adding up to the same figure as you'd get from good old mental arithmetic, counting on fingers or even an old calculator, then you'll need to tell Excel what you want.
There are three useful formulae:
=ROUND() does what Excel does naturally when you change the decimal display, rounding to the nearest number of digits indicated
=INT() may be more useful, displaying just the whole number
=TRUNC() is the best option, restricting the number stored to a chosen number of digits.

You could now, for example add up column H or I and get 30 using the usual sum formula. It is important to apply the formula at the right stage of a calculation but this might help avoid less obvious but potentially costly or embarrassing errors.
Office 2007 - where's the menu for this or that?
With acknowledgements again to Steve (trust me I'm a) Dr North at Agora, Microsoft have published some guides to help you figure out where to find the various tools that we all know exactly where to find in older versions of Word, Excel etc but can spend ages trying to find in Office 2007.
You can either access them directly on the Microsoft site or download them from there and use them off-line.
Word
Excel
PowerPoint
You can either access them directly on the Microsoft site or download them from there and use them off-line.
Word
Excel
PowerPoint
13 September 2007
Excel hyperlink color colours
There I was, actually doing something to get a bit more organised at the start of term in the shape of a timetable for my teaching when I hit a problem that had me scratching my head. Finished up having to look on various forums to get the answer so here's the problem and the solution which may save you a few hours one day!
For some reason best known to me I had used blue blocks for various lessons with white text. To make life simple I put hyperlinks on the text so that clicking a lesson would take me to the appropriate register. Of course, the text turns blue and gets underlined and is virtually invisible. Or it goes purple as a 'visited' link.

Ok, that'll be easy to fix, I say to myself. Uh-uh. Tried almost every menu. Tried the Microsoft help files but I seldom get much joy there anyway. Thought about the PCAdvisor forums but they don't have an obvious Excel place. Normally I would have popped into Woody's Lounge but that's under some redevelopment and temporarily off-line. Eventually I find Vastly Important Notes blog by Phil Libin and get the answer. Another addition to my favourites list.
You need Format | Styles and there you can change Hyperlink and Followed Hyperlink colours (or colors in MS speak).

That's better!
For some reason best known to me I had used blue blocks for various lessons with white text. To make life simple I put hyperlinks on the text so that clicking a lesson would take me to the appropriate register. Of course, the text turns blue and gets underlined and is virtually invisible. Or it goes purple as a 'visited' link.

Ok, that'll be easy to fix, I say to myself. Uh-uh. Tried almost every menu. Tried the Microsoft help files but I seldom get much joy there anyway. Thought about the PCAdvisor forums but they don't have an obvious Excel place. Normally I would have popped into Woody's Lounge but that's under some redevelopment and temporarily off-line. Eventually I find Vastly Important Notes blog by Phil Libin and get the answer. Another addition to my favourites list.
You need Format | Styles and there you can change Hyperlink and Followed Hyperlink colours (or colors in MS speak).

That's better!
08 May 2007
Why do you want to use PowerPoint?
Some notes on using PowerPoint are now available, with illustrations from an XP2003 version, probably the most used at the moment and with significant differences from the old 97 style notes. Of course now I'll start getting requests for 2007 which I haven't even seen myself yet. Anyway the complete set and some tasks will be released via the Studyzone wiki as an experiment. I'll also publish them on either a site or a blog too but, at 22 pages, that's not as easy as it sounds! here's the first page, though. The rest at this link.
- Presenting information as you might have done with OHTs in the old days
- Supporting a speech or lecture – bullet points reminding you of what to say
- Displaying images in a big way
- A slide show (literally)
- A simple way to create graphics
- Plan what you want to put on the slides (which will be different to, and much less than, what you want to say!)Start, end and middle etc. Find the images you might need and save them somewhere. If you intend to use links to web sites, store them as Favourites or Bookmarks
- Use the defaults. Leave the fonts alone. Type where suggested. Ignore all the designs and groovy backgrounds (at least until the content is finished)
- Use supplied slide layouts. Don’t add your own text areas to a blank slide unless all your doing is a picture show.
- Use a Master slide for anything that needs to appear on every slide (like a corporate logo, name, date etc.
20 April 2007
Ads and things
So that I can find out a bit more about how a variety of things that can be added to web logs work you may see all sorts of odd extra panels appear in the sidebar. Can't really advise people on these sort of things until I've tried them out myself. One will be Google's AdSense programme which will include ads., hopefully not plastered across the page or flashing annoyingly at visitors. I need to see what sort of content appears and how the adminstration works. Obviously, as I have no idea what products or services will appear, I cannot endorse any of them. To be honest, the similar stuff I've seen on other blogs or sites always looks a bit sad and I can't imagine how anyone makes any money out of this but I get so many questions about this I can't answer I need to collect some facts myself.
PowerPoint notes
With so much new stuff around these days it can be very easy to forget that sitting on most people's desktops is the excellent Microsoft PowerPoint. I've just been asked to run some sessions, some for people who've never used it before and some for those who would like to use some of the more advanced features. Of course, the people I'd really like to see are those who think they're good at presentations but aren't and those who just need to know how to speak in public! Anyway, watch this space as I'll be making the new notes available here soon.
04 April 2007
Web tools
Just completed a major revision of the Webtools site. This has links to all sorts of free wonders and links to a pbwiki site where people can leave comments on useful some might be. Cheekily, I suppose, I included this blog but it is free and it is an example of quite a few of the tools mentioned. You'll find technorati, del.icio.us and wink bookmarking tools in the left panel, for example. Only slightly odd people like me would need more than one but any one can be a great way to store sets of bookmarks or share developments on a particular theme. Must remember to tag this post . . .
04 March 2007
Making simple charts in Word
Say data and charts and the word spreadsheet comes to mind. Microsoft Excel's what you'd normally use but the word Word shouldn't be ignored. Microsoft Word has a chart facility that actually uses most of its brother application's tools and even has its own formula feature for calculations.
The simplest way to use both the formulae and charts is to put your data in a table. With a bit of care about how you set it out, and make sure you don't leave any blank rows or columns, the steps below will guide you through the process for doing some column totals, sorting the data into a different order and displaying it as a bar chart.
The simplest way to use both the formulae and charts is to put your data in a table. With a bit of care about how you set it out, and make sure you don't leave any blank rows or columns, the steps below will guide you through the process for doing some column totals, sorting the data into a different order and displaying it as a bar chart.
1 Insert a table
2 Put some headings in top row
3 Enter your data (tip: use the tab key to move which will also add rows if necessary)
4 Add an extra row for totals

5 If it’s not already showing, get the Tables and Borders toolbar, View>Toolbars>Tables and Borders or click the Tables and Borders icon on the main menu bar.

6 Click in the cell where you want the numbers above totalled and then click on the Σ key on the T&B toolbar

7 Repeat as necessary for other columns (check that it looks about right!)
8 To sort data in A-Z or 1,2,3 order of the first column, highlight what you want to re-arrange, including all the columns but not the headings or totals

9 Press the AZ or ZA button on the T&B toolbar
10 To sort in order for another column, eg by Maths results, you need to use Table>Sort and choose what you want in the window that opens. Again, it’s usually necessary to highlight all the data you want sorted (as in the previous example)


11 To make a chart, highlight the data to be included in the chart. In this case that will include the headings this time but not the totals.

12 If there isn’t an Insert Chart icon on the toolbar, use Insert>Picture>Chart

13 The default chart is a 3D column chart which will often be what you want

14 Use the corner handle to drag it out as necessary. To move it down, click on the chart, press the left arrow key and then enter to make new lines above it.
15 Enter a heading to describe what the chart shows

16 to edit the chart, double click on it. A data table will appear and you can also change almost every part of the chart.

17 If you wish to change the order of things displayed in the chart you have to re-arrange them in the datasheet that opens, not the original table. (If you do change the original table you will need to make a new chart as there is no link between the table and the chart in Word.)

18 It is usually a good idea to have labels on the axes to say what the units or categories are – there aren’t any in this example.
Note: Microsoft must have some deal with printing ink suppliers because all their default charts, and those in Excel, have grey shaded backgrounds. Totally unecessary - indeed, they make what can be a boring subject for some look even more tedious! Get rid of them. It's called the plot area and, once selected, can be changed. No fill is a good bet or, if you must have a background, you can choose from almost anything you want, including pictures. There are some more notes of that here.
28 February 2007
London, because it's the least inconvenient . . . ?
Ten people trying to decide where to meet. Everyone has a good reason for not wanting to go somewhere as well as their own preferences. How do you decide? The boss says "London, because it's the least inconvenient" and he may well be right but it would be nice to see it in writing. Rather foolishly, I thought it would be easy to knock up a spreadsheet that would add up people's votes and work out what was actually the most popular, least inconvenient or whatever. Partly because I decided to include all sorts of checking things, validation and partly because I'd never used =AND before, it took ages!
No doubt the meeting's been arranged in London by now and it really needs to work on the web to do what I wanted but maybe all the effort will be of use to someone teaching Excel or trying to figure out some formulae. The sheet's protected but there's no password. Let me know if you use it, have a better idea or spot errors.
It's a small file that you can get here. There's an on-line version that actually seems to work using Google spreadsheets. Amazing! As I might really use this I'll just give the team the address for now but will release the link genrally soon.
No doubt the meeting's been arranged in London by now and it really needs to work on the web to do what I wanted but maybe all the effort will be of use to someone teaching Excel or trying to figure out some formulae. The sheet's protected but there's no password. Let me know if you use it, have a better idea or spot errors.
It's a small file that you can get here. There's an on-line version that actually seems to work using Google spreadsheets. Amazing! As I might really use this I'll just give the team the address for now but will release the link genrally soon.
24 February 2007
Internet Explorer 7 update
Finally got round to adding some images to the notes. Blogger need to add a few tools to make image handling a bit easier, though, and it seems impossible to place them as in-line images that sit where I want them. Big pictures seem OK but not little ones so I may still finish up doing these notes as a Studyzone page and linking to it! Still, hope they're useful to someone.
10 January 2007
IE7: where have all my toolbars gone?
Microsoft's Internet Explorer 7 is a great design improvement on earlier efforts and, whilst I still prefer Firefox, there are some useful new features like tabbed browsing (which Firefox has had for ages) and a simple zoom feature (which Firefox doesn't have) that narrow the gap between the two. It does look a bit different, though, to its predecessor, and default installations may hide some of the things that you have been familiar with. So here's a quick guide to displaying some toolbars and what some of the new buttons do.
 The first thing you may want to do is get the Menu bar back. Click on the Tools button and select Menu bar.
You may find that you cannot move any of the toolbars. Under Tools, click on Toolbars and then on Lock the Toolbars if that is checked. While you're there you can restore a Links toolbar by clicking on that entry.

If the toolbars are locked the Links toolbar will only be displayed at the right edge with a chevron to click to access the links themselves. Unlocking will allow you to drag the Links toolbar across to the left to display as many link names as will fit which is usually more useful.

To add Links here, by the way, you go to the page required, click Favourites Add to Favourites and then select the Links folder to store them in. The contents of that folder are what get displayed. None of the other folders, or just Favourites generally, will feature in a bar like that, just Links which is a bit special. Sometimes that folder is stuffed with Microsoft links which you really don't need. Right click on these and delete them. No big loss. (None of this is different to IE6 or previous but thought I'd remind you).
Links and menu bar restored and now movable, you can play with some of the new toys.
The big new thing is the little square button, or tab, to the right of the one with the open page name. Click on that and you get a new window, probably with a helpful note from Microsoft on the subject. Put an address in the address bar and that will appear - but the other page doesn't disappear as it used to. It stays on its tab. You can have lots of tabs open as each time you open a new one a little square tab appears to its right (although that can be changed if you really want).

If you do have several tabs then try the four square button to the left of the row of tabs. Nice, isn't it? You get an attractive but maybe only marginally useful set of mini pages laid out on the page. Some people really like this and it does have an initial Wow factor, I suppose.
Links and menu bar restored and now movable, you can play with some of the new toys.

The big new thing is the little square button, or tab, to the right of the one with the open page name. Click on that and you get a new window, probably with a helpful note from Microsoft on the subject. Put an address in the address bar and that will appear - but the other page doesn't disappear as it used to. It stays on its tab. You can have lots of tabs open as each time you open a new one a little square tab appears to its right (although that can be changed if you really want).

If you do have several tabs then try the four square button to the left of the row of tabs. Nice, isn't it? You get an attractive but maybe only marginally useful set of mini pages laid out on the page. Some people really like this and it does have an initial Wow factor, I suppose.

Top right is the built in search which Microsoft, being Microsoft, set to their Microsoft Live search facility. You'll want Google, or one of many others maybe. Click on the little arrow next to the magnifying glass and then on Find more providers.


This takes you to a web page featuring a range of search engines and you simply choose the ones you want to add and then set the one you like best as your default.

Bottom right is a nice zoom tool. It works simply and most effectively and will be a boon to those who find text too small or just want to get a closer look.
Nothing in these notes will be new to the experts out there but they may help those to whom it all looked a bit confusing. I'll write about some of the more advanced tweaks later.
Images to follow for this post.
Subscribe to:
Posts (Atom)